LABron Gets Some Gear
Introduction
In this lab we built out our robots sensors to include photodiodes and a microphone. The goal of Lab 2 was for our robot to be able to respond to a 660Hz whistle and separately detect both a 6.08 kHz and 18 kHz IR signal emitted from treasures and other robots respectively. To accomplish this, we split into two groups, an Acoustic Team and an IR Team. The Acoustic Team was composed of Ho-Jung and David. The IR Team was composed of Rohan and Shubhom. Below we detail the methodology by which we accomplished these tasks.
Fast Fourier Transform Library
The purpose of the Open Music Labs Arduino FFT package is to quickly identify the frequency of inputs to the Arduino. Ideally, analog filters we create will be able to attenuate different signals from other robots, decoys, and background noise so that we can clearly distinguish and the start whistle. In addition to analog filters, we created amplifiers to amplify the start signals and treasure IR signals better. In the Fourier transform, the frequency of the amplified received signals will have a significantly higher amplitude than other attenuated and background frequencies, making detection of treasures and start signals simple. As a result, the FFT is a convenient way to sample frequencies in a way that can be used with Arduino logic to allow robots to interact with their surroundings.
From the Atmega 328p datasheet, the ADC has
a conversion rate up to 76.9 kSPS
(kilosamples per second), and up to 15 kSPS
at maximum resolution. Changing the
prescalar of the ADC can change its
conversion rate for analogRead. Currently, the prescalar
on the ADC is set to 128, which for a
system clock of 16 MHz means the ADC is
running at 125 kHz clock. A search
online
says, the ADC
then runs ~9600 Hz because it takes ~13
cycles to make a conversion. If the
sampling rate is 9600 kHz, it would be too
small because the highest signal that could
be detected with no aliasing in the system
is 9600 * 0.5 = 4800 Hz. This is higher
than the 6.018 kHz IR signal we need to
detect. The normal range of human voice is
85-180 Hz (male) and 165-255 Hz (female).
The harmonics will be an issue for the 660
audio start signal. The frequency of
fluorescent lights in the room are 120 Hz,
and might be a problem for the IR sensor.
Audio Team
In this section we will discuss how Ho-Jung and David were able to construct a functioning microphone circuit on a separate breadboard and determine frequency using the FFT library.
Building the Microphone Circuit
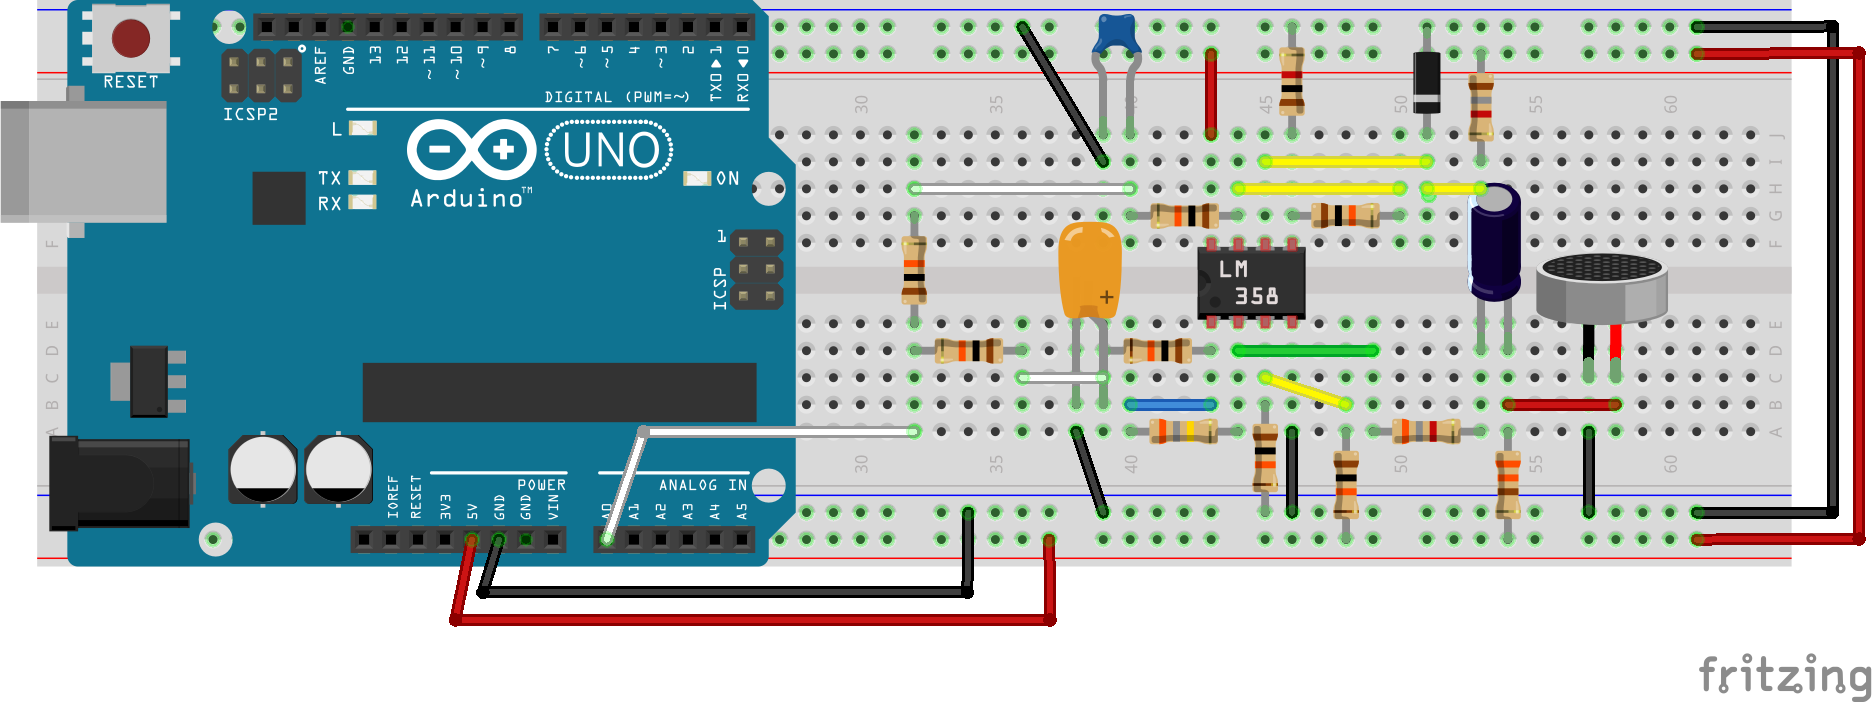
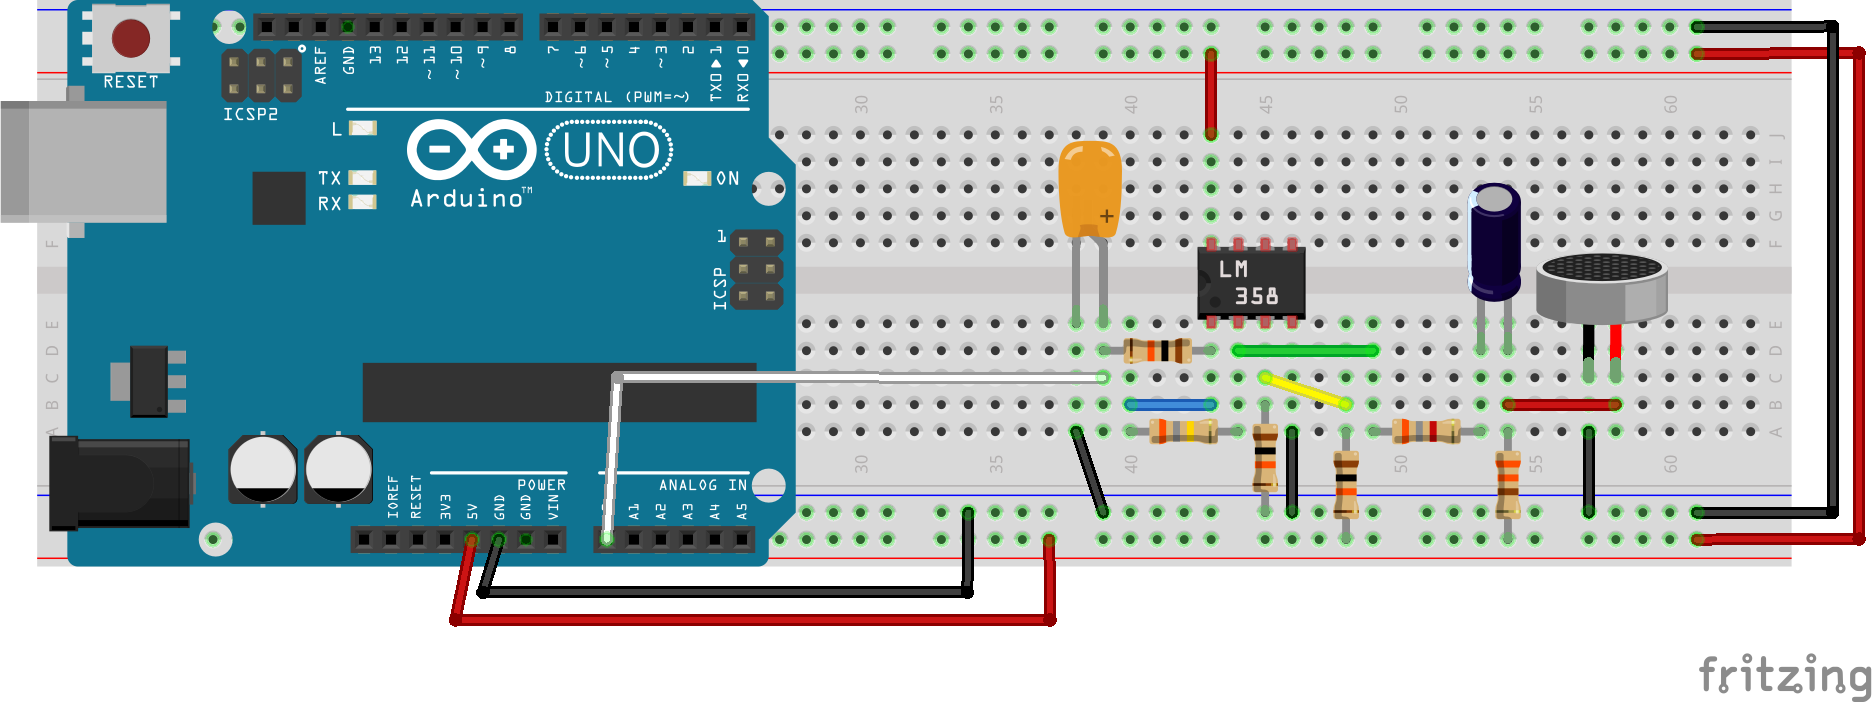
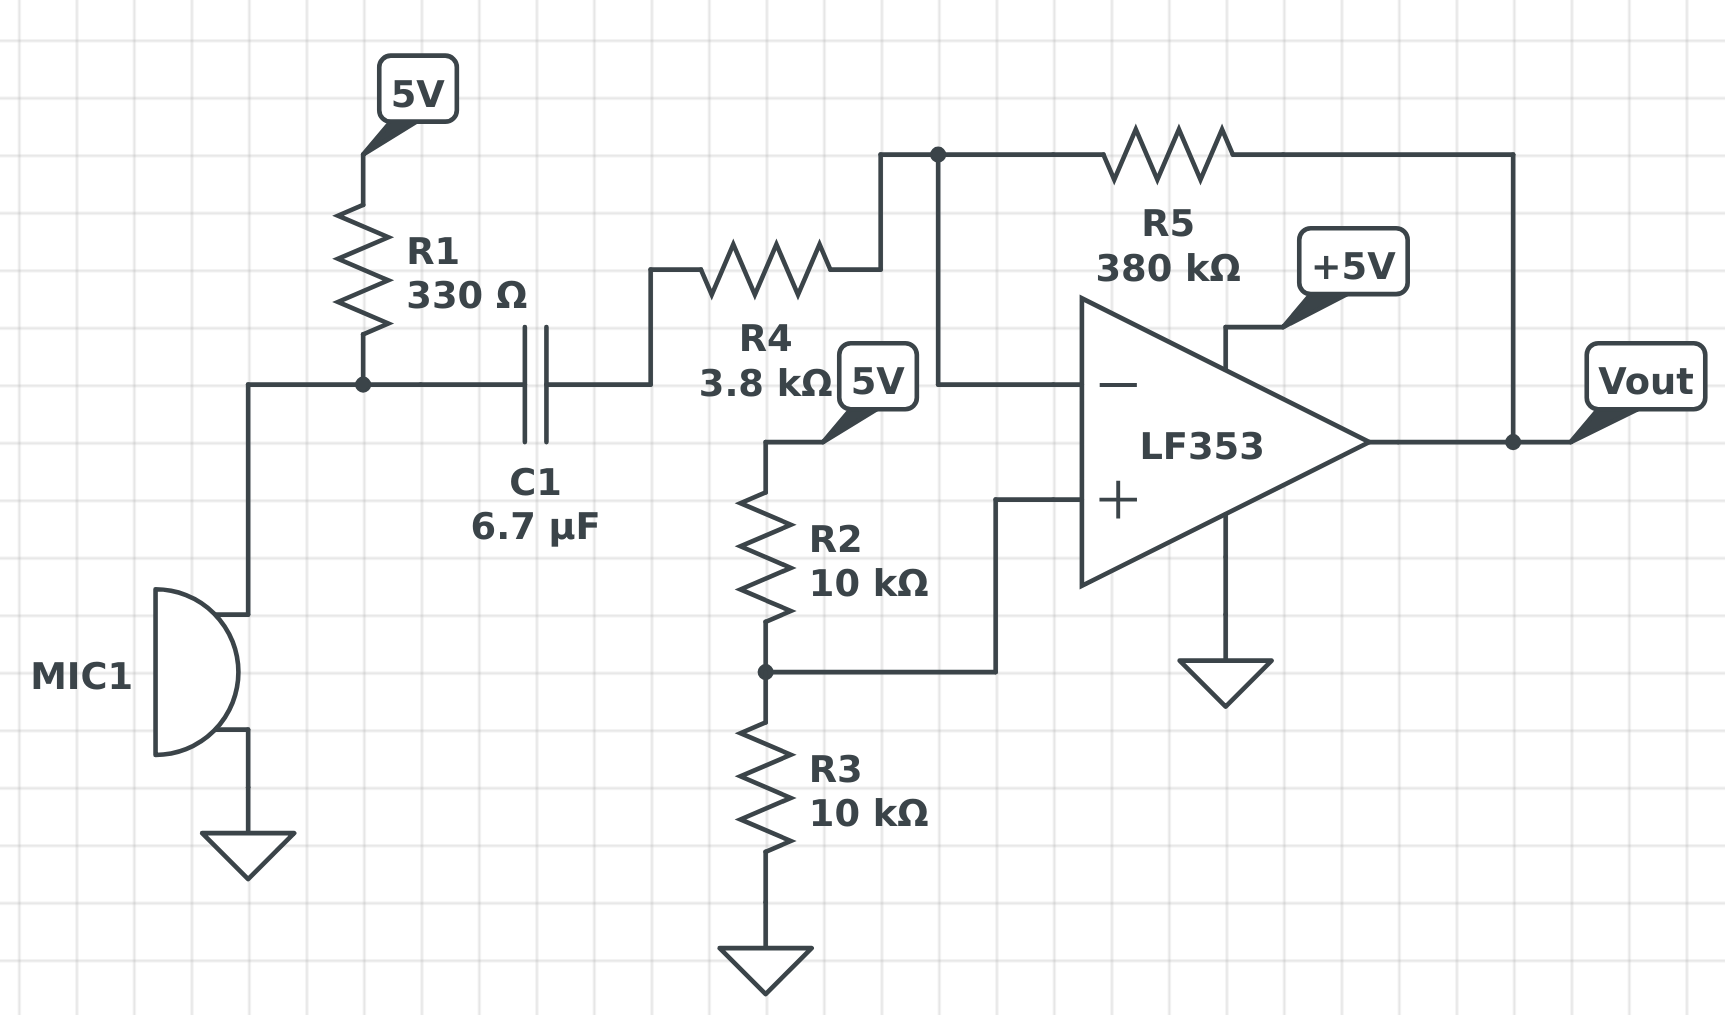
Before we are able to determine the presence of a 660 Hz signal in the robots environment, we need to wire the microphone sensor correctly and start receiving digital pulses encoding the audio impulses around the circuit. We made a simple inverting amplifier with ~100x gain based on Team Alpha's design. A schematic of it is shown below. We originally tried a non-inverting configuration, but the output's DC bias kept slowly creeping upwards, making the amplified output clip.
The microphone takes an audio signal and it is sent through a DC blocking capacitor. Then, this signal is amplified with an inverting amplifier that has a DC bias at 0.5*V_cc. Since V_cc was 5V for us, the op amp output is centered at 2.5 V (so, halfway between the power rails). This allows for the max signal swing at the output without clipping.
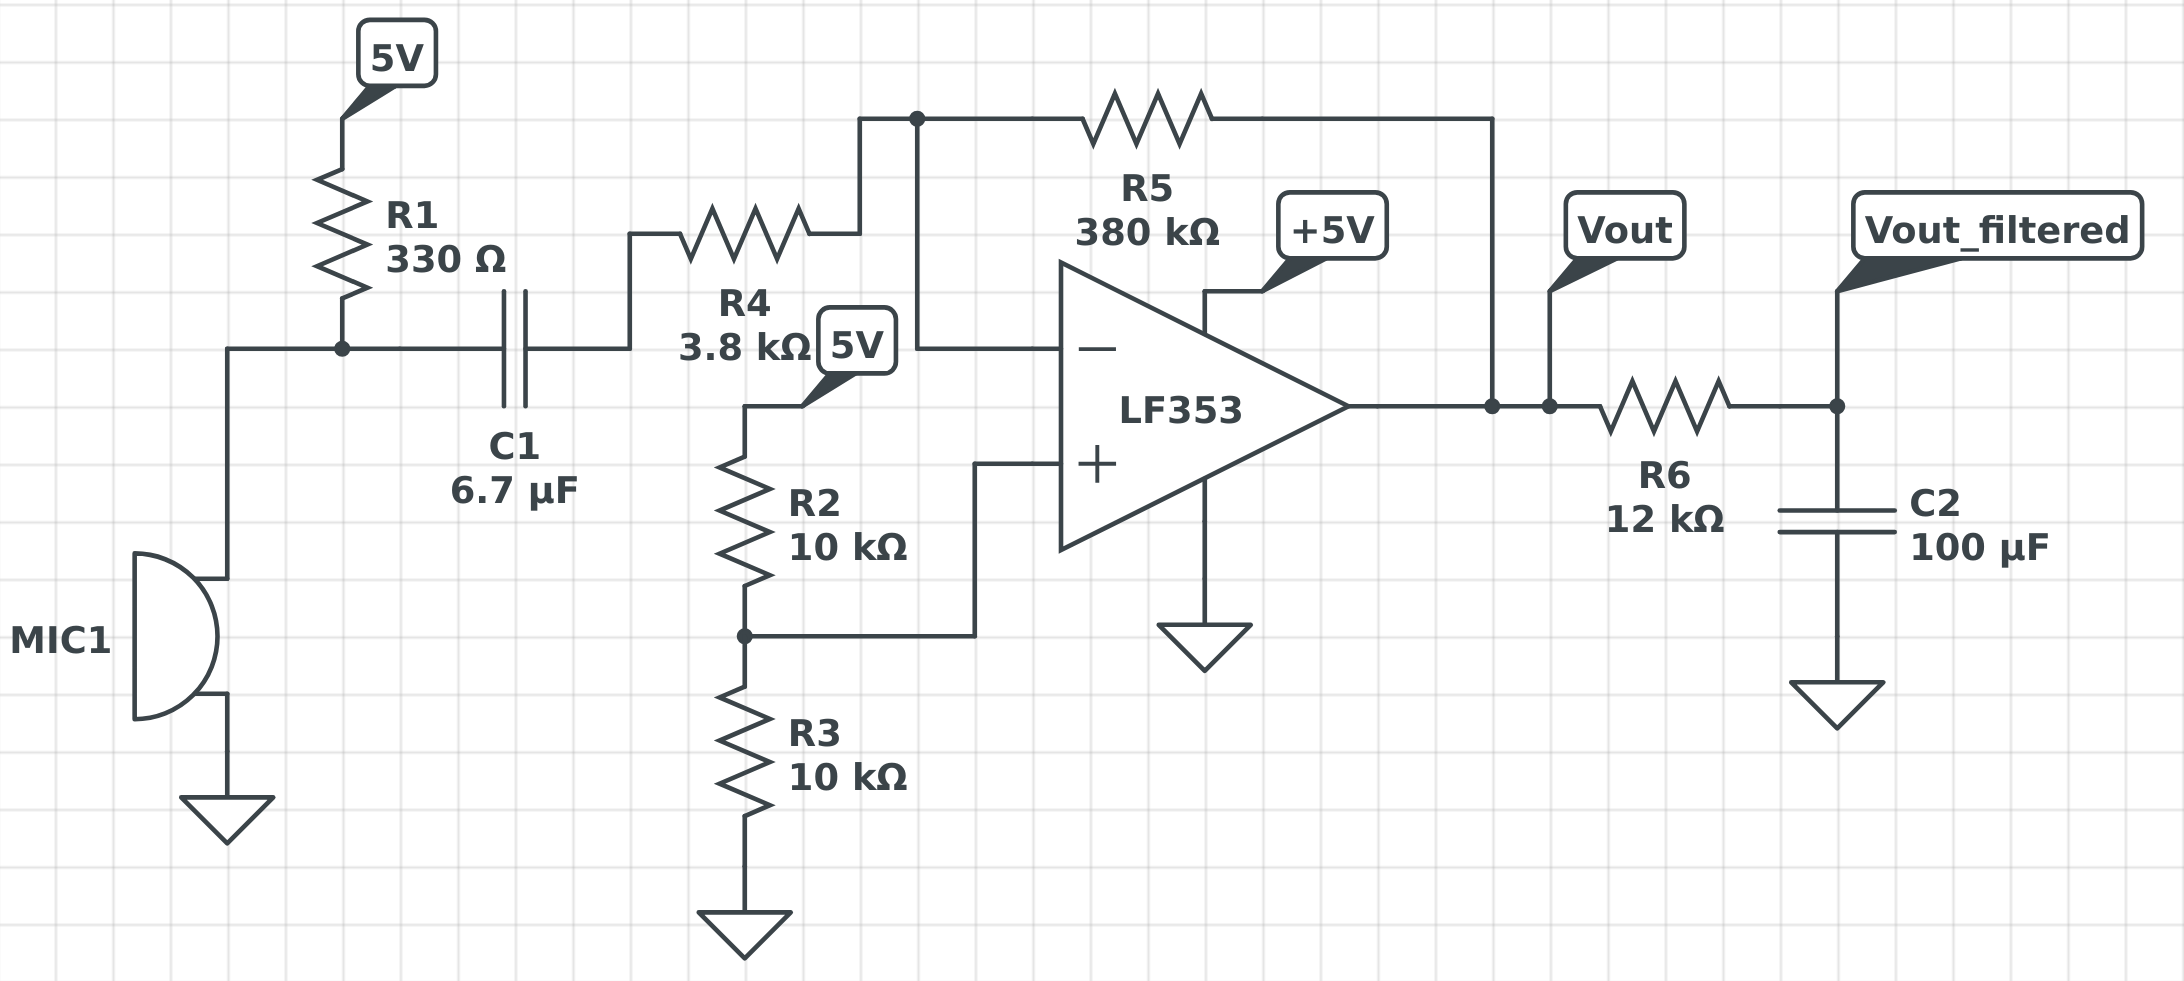
Detecting our Desired Audio Signal
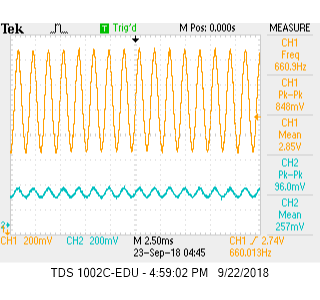
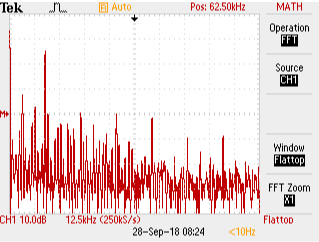
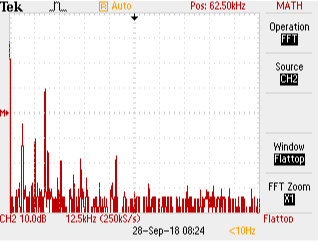
We combined a simple RC low pass filter after the output of the amplifier to block out background chatter and any decoy frequencies. When putting the amplified microphone signal on the scope, we saw a spurious ~1300 kHz frequency so we made a low pass with a R = 12 kΩ; and C = 100 uF to get a cutoff frequency of \( 1 \over 2 \pi RC \)= 1326 Hz. A picture of the microphone signal amplified is shown, with the microphone signal in blue and the amplified signal in yellow. FFTs of the whole system is also shown, unfiltered on the top and filtered on the bottom. From this, it can be seen that the filter attenuates the spurious frequency a bit.
Oscilloscope FFT Outputs
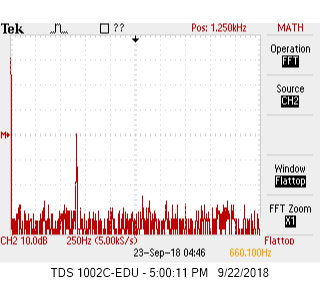
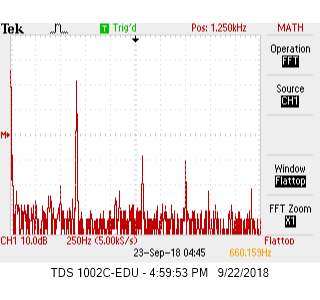
On the left we see the pre-amplified unfiltered signal, while the total circuit output is shown on the right. Notice that the FFT displays a number of harmonics which end up in our signal output. These are digitally filtered/ignored later.
Identifying Signals
Finally, we were able to use the Arduino FFT Library to begin detecting the 660 Hz signal that we were searching for. We find the max point of FFT magnitudes at 660 Hz. From this point, all we had left to do is the creation of an automatic detection algorithm for both audio and IR signals.
When running the FFT, we saw that the 660 Hz signal was in bin 6. This led us to believe that the Arduino was actually sampling ~67 kHz instead, because for 256 samples, the 255th sample = \( fs \over 2 \). So, each bin is \( fs \over 2\)\(1 \over 256\). Since the 660 Hz was in bin 6, 660 (Hz) = \(fs \over 2\)\(1 \over 256\)\(6\) (Hz). Note the the FFT shown was not normalized.
IR Team
In this section we will discuss how Shubhom and Rohan were able to implement the IR sensor on a separate breadboard and capture correct frequency analyses using the FFT library.
Beginning to Sense IR
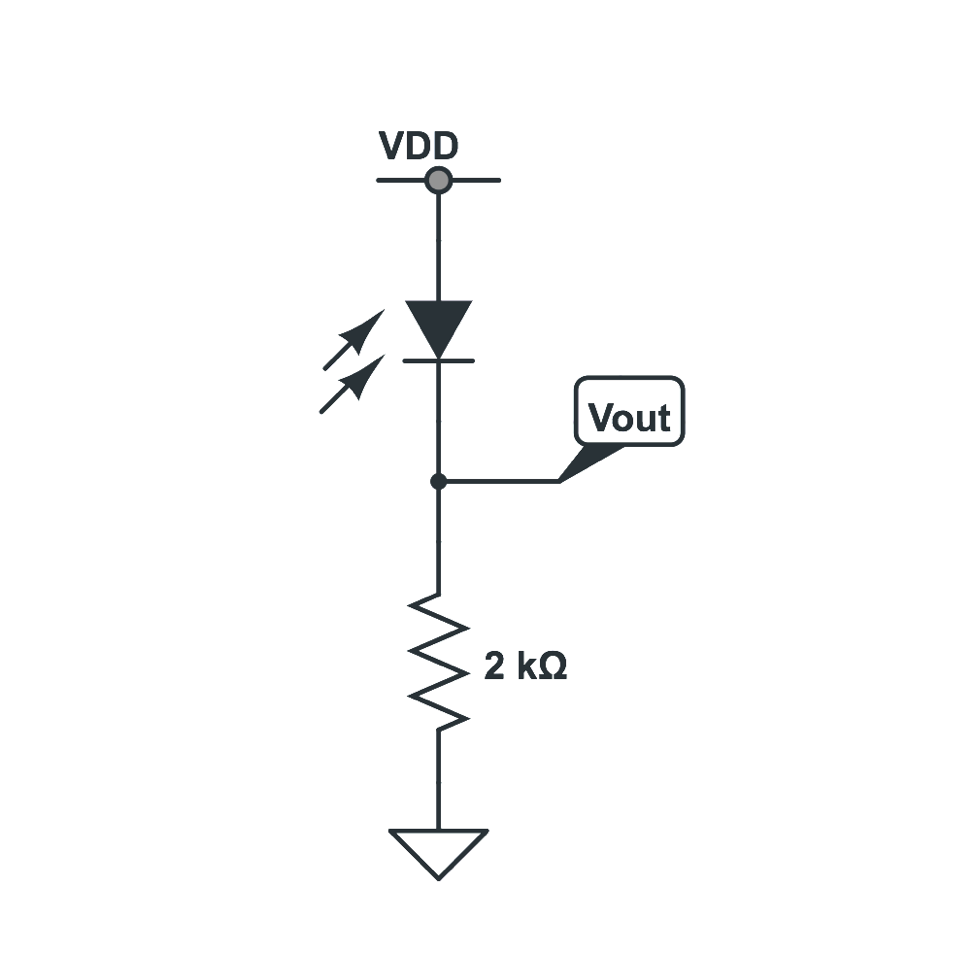
We were able to begin sensing IR light with a very simple setup. We place our Vout node connected to a pulldown resistor, separated from Vdd by the phototransistor sensor. This design rests at 0V in the absence of IR light, and rises as sensed IR light allows current to flow through the circuit and a growing voltage drop is measured across the resistor. Increasing the resistance here would make circuit more sensitive, but for our needs a 2kΩ was enough.

Adding Analog Filtering and Gain
The rationale behind this decision was relatively straightforward. The signal we were picking up off our IR sensor would fall to 0V i n the absence of light, but rests very close to 0V when detected IR light isn't very strong as well. Amplifying our sensor output would therefore allow us to see the consistent 6.08 kHz signal we are looking for. However, the 18 kHz signal's proximity in the frequency domain to 6.08 kHz would result in some saturation of the signal we're searching for. This is because there were a lot of harmonics from both signal sources. In order to avoid this issue, we implemented a low pass filter with a pole of ~16 kHz to reduce the amplitude of the decoy signals and noise our robot would have to parse through. (R = 10 kOhm, C = 1 nF so f_c = 15.9 kHz). Pictured above you can view our FFT analysis of a 6.08kHz signal before amplification and filtering. Below you can view the post amplification and filtering results.
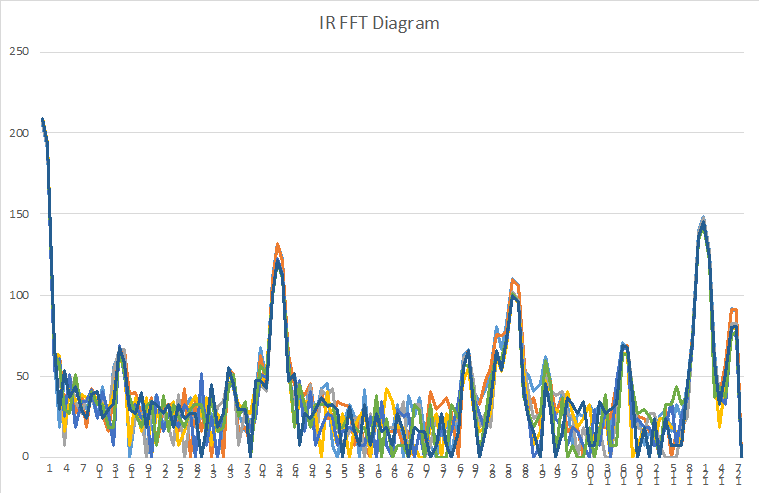
Software Interpretation of Signal
Determining the presence of a 6 kHz signal right now is done using the FFT library. We find that the signal 6.08 kHz signal appears in bins 44. The decoy signal appears in bin 122. This roughlyagrees with what we saw earlier, with a f_s ~67 kHz because f_{detect_robot} = (f_s/2)*(1/L)*(bin_number), where L = number of samples (256) and same for f_{decoy}. So, f_{detect_robot} = 5.808 kHz and f_{decoy} = 16kHz, which is off but might have been the next highest peak detected due to the harmonics of both the robot and decoy robot falling into the same frequency bin and adding up. Because we generally see a large amount of environmental IR light, we only say that a 6.08/18 kHz signal is present when the perceived amplitude is of a predefined threshold in magnitude. This threshold is determined by analyzing all FFT frequencies and observing the largest peaks, then calculating a relative threshold based off these values. The program logic then assesses if the bins where we expect to see the whistle signal (660Hz), IR hat (6.08 kHz), and IR Decoy (18 kHz) contain FFT magnitudes that surpass the threshold we defined.
Automatic Detection and Summary
In the end, we could distinguish a 6.08 kHz
signal from a 18 Hz IR signal (video below).
The video below also shows both the audio and
IR code working together, and shows the Arduino
distinguishing a 660 Hz tone from the music on
the phone close to it (playing from Spotify).
When the 660 Hz tone is detected, the Serial
monitor prints out Whistle
detected!. When the IR hat is
detected, IR hat detected! is
printed, and when the IR decoy is detcted,
IR decoy detected! is printed.
(You may have to pause the screen during the
Serial monitor printouts.)
In our setup, all 3 messages are printed because we put all 3 components together to show they could all work together in 1 system.
Previously, we were able to determine which FFT bins a signal would fall into within some range of error (eg ± 2 bins). Armed with this knowledge, we were able to create a deteciton algorithm for each of the 3 signals we were using around our robot: a 660 Hz audio signal, a 6.08 Khz IR signal, and an 18 kHz IR signal. Above a detected threshold, we determined that the signal was in fact present in the robots environment. To make it simpler to run the FFT on bother IR and audio circuit outputs, we combined the Amplifier signals using a simple adder circuit (pictured below) and were thus able to analogRead on one port and run the FFT on this data, cutting down on processing by a factor of 2. By the end of this lab, we were able to successfully determine the frequency of signals in our robot's environment and respond to cues.